
Unlock efficient revenue growth
with Realm
Your top customer just went radio silent. Usage dropped 40% last month, support tickets tripled, and your CSM can't get the champion on the phone. By the time you realize something's wrong, the renewal conversation is already lost.
Customer health scores solve this problem by turning scattered signals fromproduct usage, support tickets, engagement patterns, and relationship quality into a single predictive metric that flags churn risk 60–90 days before it happens.
This guide explains what customer health scores are, which metrics matter most, how to build a scoring system from scratch, and how AI automates the entire process so your team can focus on saving accounts instead of aggregating data.
What is a customer health score?
A customer health score is a single number that tells you whether a customer will renew, expand, or churn. It combines product usage, support tickets, engagement levels, and relationship quality into one metric, typically on a 0–100 scale or as red/yellow/green status.
Think of it like a credit score for your customer relationships. Just as lenders use credit scores to predict loan defaults, customer success teams use health scores to predict churn before it happens. The score answers one question: Is this customer thriving or dying?
Here's why it matters. When you have 20 customers, your CSM knows each account personally. At 200 customers, personal knowledge breaks down. Health scores scale that intuition by turning scattered signals across usage data, support tickets, and CSM notes into a single, actionable metric that tells you where to focus.
Why customer health scores matter for B2B SaaS companies
Customer health scores solve the fundamental problem every CS leader faces: you can't be in every account at once. Without health scores, you're flying blind; reacting to churn after customers have already mentally checked out.
- Predict churn 60–90 days early: Health scores flag at-risk customers before renewal conversations start. When a customer's usage drops 40% and support tickets spike, the score plummets, alerting your team while you can still intervene. By the time a customer tells you they're "evaluating alternatives," it's too late.
- Spot expansion opportunities: High scores reveal customers crushing it with your product. A customer at 95% health score, using advanced features, and hitting usage limits? That's your upsell conversation teed up.
- Triage your team's time: Not every customer deserves equal attention. Health scores let you direct CSM time toward accounts that need saving or are ready for expansion. Instead of spreading effort evenly across your entire book.
- Replace gut feel with data: "I think this account is fine" doesn't work in pipeline reviews. Health scores give you objective evidence. A score of 75 means something specific. A score of 35 triggers specific actions.
Core customer health score metrics

Building a health score starts with picking the right inputs. Most successful models combine five metric categories, though the exact mix depends on your product and customer base.
Product usage
Product usage tracks how often and how deeply customers engage with your product. Login frequency matters, but feature adoption matters more. A customer logging in daily to export a report isn't as healthy as a customer using your core workflow features.
For example, a project management tool tracks whether customers create projects, assign tasks, and use collaboration features. Not just whether they log in. A CRM measures whether customers are sending campaigns and tracking deals, not just viewing dashboards.
Onboarding completion
Customers who finish onboarding are 3–5x more likely to renew than customers who don't. Onboarding milestones predict long-term success better than almost any other metric.
Track specific milestones that correlate with retention in your product. For a marketing automation platform, this might be: imported contacts, sent first campaign, and connected integrations, all within 30 days. Customers who hit these milestones stick. Customers who don't, churn.
Support ticket volume
Support interactions reveal customer health in two ways. First, ticket volume, customers filing frequent tickets often struggle with your product. Second, ticket severity, escalations and unresolved issues signal serious problems.
But context matters. A customer filing one critical bug per quarter might be healthier than a customer filing zero tickets because they've stopped using your product. Look at ticket trends, not just absolute numbers.
Net Promoter Score
NPS captures sentiment that usage data misses. A customer might use your product daily out of necessity while actively hunting for alternatives. Quarterly NPS surveys reveal this dissatisfaction before it becomes churn.
Track NPS trends over time. A customer dropping from 9 to 6 over two quarters? That's a leading indicator of trouble, even if their usage looks fine.
CSM pulse
Your CSMs develop intuition about account health through regular conversations. Their qualitative assessments such as relationship strength, executive engagement, and business outcome alignment capture signals that data can't.
A CSM might note: "Champion left the company" or "Customer's strategic priorities shifted away from our use case." Both are churn risks that won't show up in usage data for months.
Expansion signals
Expansion indicators reveal customers ready for growth conversations:
- Usage approaching limits: Customer at 90% of API calls or 9 of 10 seats
- Feature requests: Questions about enterprise features or advanced capabilities
- New use cases: Mentions of additional teams or departments wanting access
- Executive engagement: C-level asking about roadmap or strategic alignment
When you spot these signals, your customer isn't just health, they're ready to spend more.
Step-by-step guide to building customer health scoring system
Creating a health score from scratch feels overwhelming. Break it into six steps, start simple, and refine based on real data.
1. Segment your accounts
Enterprise customers and SMB customers have different health profiles. Treating them identically produces misleading scores. Your enterprise accounts look unhealthy because they don't match SMB usage patterns.
Segment on three dimensions. First, deal size: enterprise vs. mid-market vs. SMB. Second, lifecycle stage: onboarding vs. steady-state vs. renewal. Third, vertical or use case if your product serves distinct customer types.
2. Select quantitative metrics
Pick 3–5 metrics that correlate most strongly with retention. More metrics don't make better scores, they create noise. Look at your churned customers from the past year. What patterns emerge? Did they log in less? Stop using key features? If you see consistent patterns, those metrics belong in your score.
Start with the basics: login frequency, feature adoption rate, and active users. Add complexity later.
3. Add qualitative inputs
Balance quantitative metrics with CSM assessments. Create a simple framework for CSMs to rate relationship strength, executive engagement, and outcome achievement on a 1–5 scale.
For example: Rate executive engagement as 5 if you have quarterly business reviews with VPs, 3 if you only speak with managers, and 1 if you can't get meetings scheduled.
4. Assign weights and ranges
Not all metrics matter equally. Product usage typically carries more weight than NPS because it's a leading indicator, usage drops before satisfaction scores do.
Start with simple weighting:
- 40% product usage: Core feature adoption and frequency
- 20% support health: Ticket volume and severity trends
- 20% CSM pulse: Relationship and engagement quality
- 10% NPS: Customer satisfaction and loyalty
- 10% expansion signals: Growth and upsell indicators
Define score ranges that trigger actions: 0–40 = Critical (immediate intervention), 41–60 = At-risk (proactive outreach), 61–80 = Healthy (standard cadence), 81–100 = Thriving (expansion opportunity).
5. Build a customer health dashboard
Your health score lives in a dashboard that your entire CS team checks weekly. The dashboard shows each account's current score, trend over time, and which specific metrics are driving the score up or down. Salesforce, HubSpot, Gainsight dashboard all work. The key is accessibility. CSMs check it weekly, not monthly.
6. Review and refine quarterly
Your health score model isn't permanent. Review it quarterly by comparing predicted health against actual outcomes. If customers with "healthy" scores are churning, your model needs adjustment.
Test changes systematically. Adjust one variable at a time. Change a weight, add a metric, modify a threshold, and then measure whether the change improves accuracy.
Customer health score templates and scorecards
Rather than building your approach tocustomer health score from scratch, start with proven templates. Here are two frameworks for different customer types.
Template for high-touch enterprise accounts
Enterprise customers have dedicated CSMs who provide rich qualitative data. Relationship quality and executive engagement matter more than raw usage numbers because enterprise customers often use your product in steady-state rather than growth mode.
Recommended weighting: 25% product usage, 30% CSM relationship pulse, 20% executive engagement, 15% business outcomes achieved, 10% support health.
An enterprise customer might have moderate usage but strong executive relationships and clear ROI. This customer scores high despite not being a power user.
Template for tech-touch SMB accounts
SMB customers managed through automated playbooks rely almost entirely on behavioral data. You lack regular human touchpoints, so usage patterns carry most of the weight.
Recommended weighting: 50% product usage, 20% feature adoption, 15% support ticket ratio, 10% NPS, 5% payment health.
An SMB customer logging in daily, using core features consistently, and filing zero support tickets scores high, even without CSM conversations.
Interpreting customer health score and acting on it
A health score only matters if it drives action. The number doesn't save customers. Your response does. Build playbooks that trigger when scores cross critical thresholds.
Playbook for at-risk accounts
When a customer's score drops below 60, execute a structured intervention. First, investigate root cause: is it usage drop, support issues, or relationship deterioration? Second, schedule an urgent check-in to understand what changed. Often, the customer doesn't realize they're off track.
Common root causes: champion left the company, team lacks training on new features, business priorities shifted away from your use case.
Third, build a success plan with specific milestones. For example: complete advanced training by end of month, achieve specific usage metric by next quarter, schedule executive business review within 30 days.
Playbook for expansion opportunities
Scores above 80 signal expansion readiness. Your playbook focuses on identifying the specific opportunity, more seats, higher tier, additional products and timing the conversation right.
Analyze which features the customer uses heavily and where they're approaching plan limits. At 95% of API calls? That's a natural upgrade conversation. Asking about enterprise features? That's your opening for tier upgrade.
Time conversations strategically. The best moment is 60–90 days before renewal when the customer is already thinking about their contract but hasn't mentally committed to status quo.
Business health score assessment vs customer health scoring
Business health score assessments and customer health scores sound similar but measure different things. Customer health scores assess individual relationships will this specific customer renew? Business health assessments evaluate your company's overall performance revenue growth, CAC, gross margin.
Customer health scores are leading indicators that predict future revenue. Business health assessments are lagging indicators that report past performance. You use customer health scores to prevent churn. You use business health assessments to report to your board.
They're connected though. If your aggregate customer health scores trend downward, your business health metrics will deteriorate in coming quarters.
Tools to automate customer and client health scores
Manual calculation doesn't scale beyond 50 customers. Once your customer base grows, you need automated systems that calculate scores continuously and alert your team to changes in real-time.
Gainsight health score
Gainsight pioneered customer health scoring for SaaS. The platform ingests data from your product, CRM, support system, and CSM inputs to calculate scores automatically. Gainsight's strength is flexibility. You can build complex scoring models with multiple metrics, custom weighting, and account segmentation. The tradeoff is implementation complexity and cost.
In-house BI dashboards
Some companies build custom health scores using Tableau, Looker, or similar. This gives you complete control and avoids vendor costs. The downside is maintenance burden. Your data team owns the model, and updates require engineering resources.
Realm's Customer Health Score AI Agent
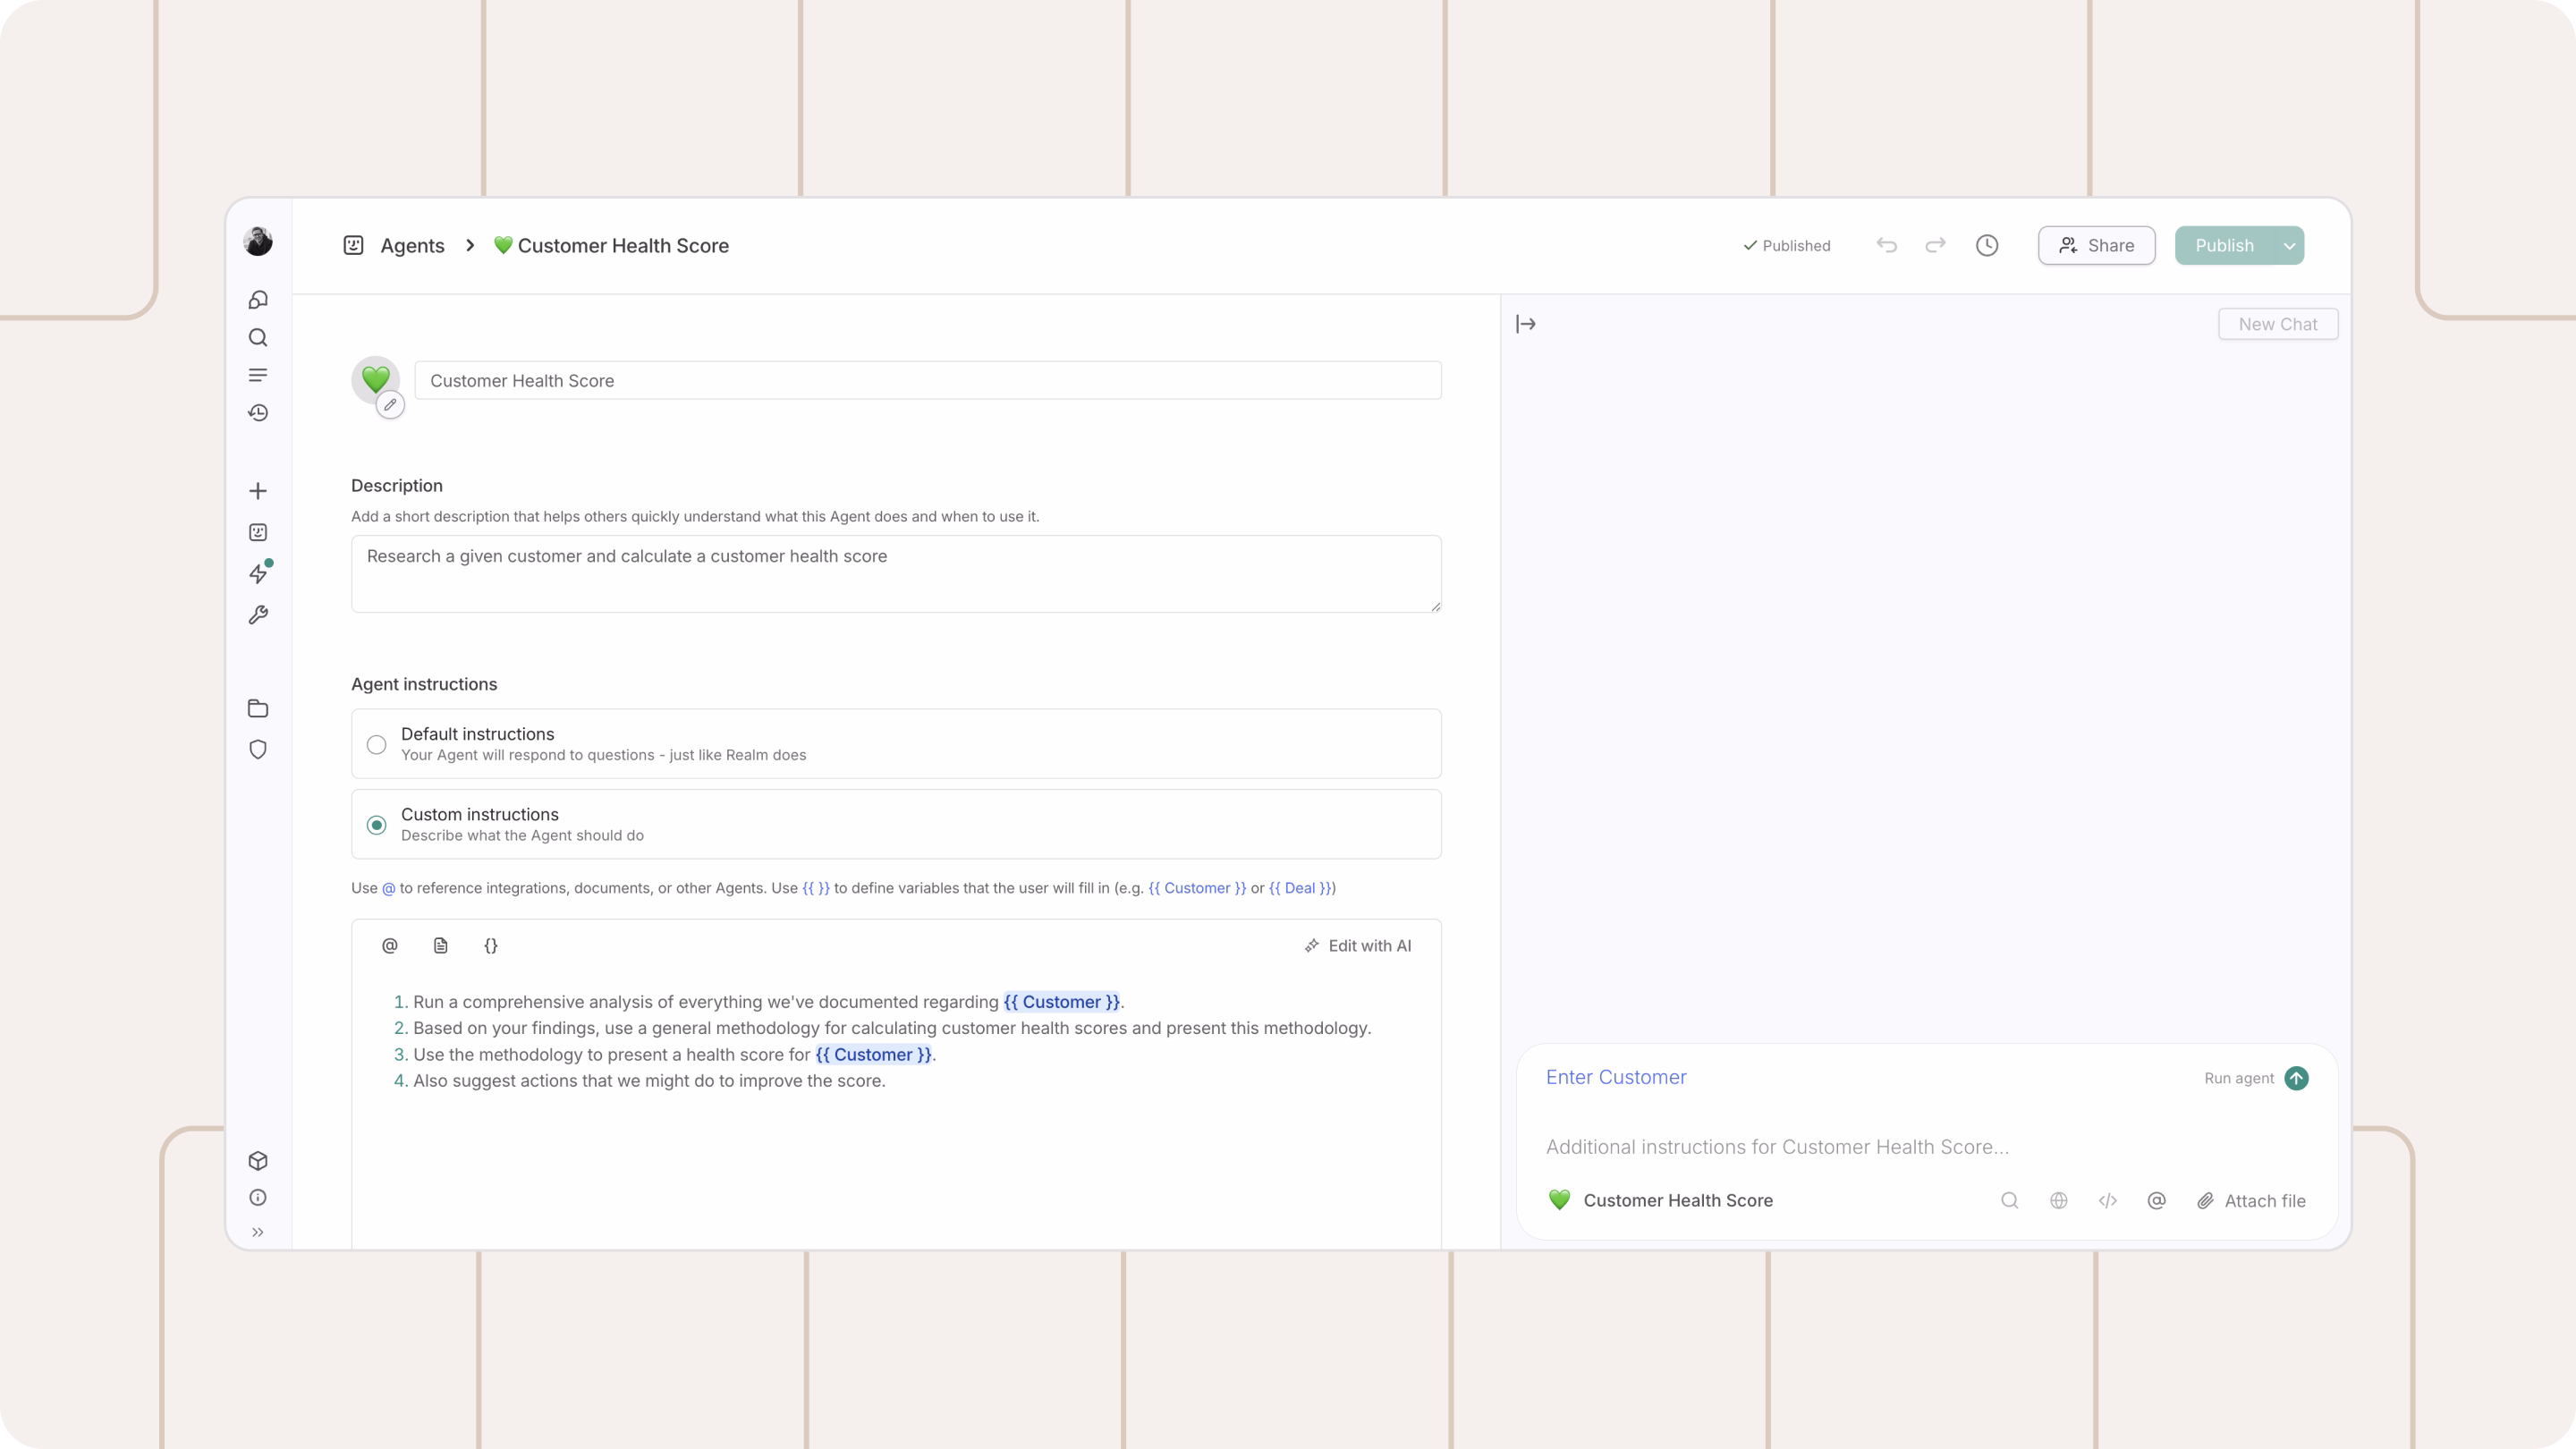
Customer Success Managers spend hours reviewing dashboards, hunting through Slack threads, checking support queues, and trying to remember recent interactions, all to answer one question: "Where we stand regarding this customer?" Without a systematic process, health assessments are inconsistent, subjective, and reactive rather than proactive.
Realm's Customer Health Score AI Agent transforms this process. Instead of manually gathering and analyzing data, CSMs can generate a comprehensive, data-driven health assessment in minutes. The agent automatically reviews usage patterns, engagement signals, support activity, and recent product changes, then delivers a clear health rating (Healthy, Needs Attention, or At Risk) with supporting evidence and recommended next actions.
Here's how the agent works:
- Aggregates account signals by searching across HubSpot, Salesforce, Slack, Linear, and Notion to surface usage trends, engagement patterns, and recent interactions
- Identifies risks and concerns by reviewing open support issues, feature requests, internal team discussions, and renewal status
- Analyzes product impact by checking changelog updates and recent releases that may have affected the customer experience
- Assigns a clear health rating using a traffic light system: Healthy (strong engagement, no risks), Needs Attention (flat usage, some concerns), or At Risk (declining engagement, unresolved issues)
- Highlights positive signals by surfacing success moments, usage growth, and engagement wins worth celebrating
- Delivers actionable recommendations with a summary report including key metrics, risk assessment, positive signals, and next steps for the account owner
Common pitfalls in customer health scoring
Even experienced CS teams make predictable mistakes. Here are three common ones and how to avoid them.
Overweighting activity over outcomes
High product usage doesn't always mean healthy customers. A customer might log in daily because your product requires constant manual work to accomplish basic tasks. Focus on outcome-based metrics when possible. Goals completed, workflows automated, value delivered.
Ignoring customer segmentation
Enterprise and SMB customers have fundamentally different health profiles. Treating them identically produces misleading scores. Build separate models for distinct customer segments. At minimum, segment by deal size and lifecycle stage.
Treating the score as static
Your business evolves, your product changes, and customer behavior shifts. A model built in 2023 won't accurately predict churn in 2025. Review your model quarterly; compare predicted health against actual outcomes. If you're seeing surprises, your model needs recalibration.
Final thoughts on customer health scoring
Customer health scores transform customer success from reactive firefighting into proactive account management. Instead of discovering churn risk during renewal conversations, you identify warning signs months earlier, when you can still change the outcome.
Start simple with 3–5 core metrics, test your model against historical data, and refine quarterly. The goal isn't perfection on day one. It's building a system that improves over time. The modern advantage lies in automation—AI-powered platforms eliminate manual work, making rigorous customer monitoring scalable across hundreds of accounts.
FAQs about customer health scores
How often should customer health scores be recalculated?
Most teams update health scores weekly or monthly depending on data freshness and customer lifecycle speed. Real-time updates work best for high-velocity businesses where customer behavior changes rapidly, while monthly updates work for enterprise customers with longer engagement cycles.
What is a good customer health score threshold for B2B SaaS?
Healthy scores typically fall above 70 on a 100-point scale, though thresholds vary by business model and customer segment. Focus on relative scoring within your customer base rather than absolute benchmarks, what matters is whether your scores accurately predict renewal and churn in your specific business.
How can qualitative customer success manager inputs be included without bias?
Use structured assessment frameworks with specific criteria rather than subjective ratings. Train CSMs on consistent evaluation methods and regularly calibrate scoring across the team to make certain everyone applies the same standards when rating relationship strength and engagement levels.
Can product health metrics replace traditional customer engagement metrics entirely?
Product usage data provides valuable insights but complements rather than replaces relationship and satisfaction metrics. The most effective health scores combine quantitative product data with qualitative relationship indicators; customers can use your product extensively while actively searching for alternatives if the relationship deteriorates.